
Sustainable Manufacturing and Foundry Practices

 Search

1National Institute of Technology Manipur, Imphal, Manipur, India

Creative Commons Non Commercial CC BY-NC: This article is distributed under the terms of the Creative Commons Attribution-NonCommercial 4.0 License (http://www.creativecommons.org/licenses/by-nc/4.0/) which permits non-Commercial use, reproduction and distribution of the work without further permission provided the original work is attributed.
The present work investigates the influence of variations in cutting speed, feed, depth of cut and nose radius on both machining energy intake and the resulting surface texture throughout turning of AA7075 reinforced with 15 wt% SiC particles, sized 10–20 µm. The response surface methodology (RSM) technique was employed to accomplish the minimum surface roughness and energy utilization. 3D surface curves of RSM showed cutting speed to be the key reason in minimizing surface roughness and energy intake, and subsequently depth of the cut, feed and radius of nose. Multi-response optimization values of cutting factors through turning of AA7075/15 wt% SiC to minimize surface roughness and energy utilization have been found by desirability analysis. The results show that a 16.06% reduction in surface roughness can be achieved by merely increasing electrical energy consumption by 4.88%. Turning to the cutting parameter value obtained by multi-response optimization results in the reduction of energy consumption and surface roughness. Naturally available materials were utilized for fabrication. The novelty of this work is that scarce literature has been reported on the determination of the optimal process parameters for turning AA7075/15 wt% SiC (10–20 µm) composites at which minimum electrical energy will be consumed, and minimum surface roughness will be obtained.
Desirability approach, energy consumption, surface roughness, AA7075, multi-objective optimization, Response Surface Methodology
Introduction
Manufacturing of good quality at minimum fabrication cost is a need of the industry. Machining environments, for example, nose radius, feed, speed of cutting and depth of cut in turning manoeuvre, must be optimized to minimize the total manufacturing cost of each component. The cost of computer numerically controlled (CNC) machines is higher than that of lathe machines. Hence, CNC machines must be operated efficiently to recover extra costs. Machining at elevated cutting speeds tends to accelerate tool wear and can lead to increased vibration along with higher electrical energy requirements. However, fast speed cutting is preferred because chip removal is fast. Therefore, there was little heat transfer to component. Hence, the possibility of thermal distortion was reduced. The novelty of this work is that exploration is needed to govern the consequences of factors on energy consumption and component surface roughness at high-speed dry turning. However, the challenge is if high speed is used for fast material removal or to minimize surface roughness, machine energy consumption will increase. Hence, some technique is required for optimization. Design of experiments (DOE) is the design of the experiment so that a minimum number of experiments are needed to draw correct conclusions (Montgomery, 1997).
Literature Review
Thomas and Chanderasekaran (1997) utilized a complete factorial strategy to discover the role of machining factors on the resulting surface coarseness during the carbon steel turning. Yang and Tarng (1998) used the Taguchi method to obtain optimal parameters for machining. Choudhury and EI-Baradie (1997) used response surface methodology (RSM) to find surface roughness while machining extra-stiff steel. Thiele and Melkote (1999) utilized a factorial strategy to find the influence of component stiffness and apparatus profile on surface coarseness and machining powers. Antony (2000) carried out multi-response optimization utilizing Taguchi’s loss function and principal component analysis. Lee et al. (2000) used a polynomial network to create a machining database. Lin et al. (2001) utilized an addictive network to build a prediction model for surface roughness and cutting forces. Muthukrishnan et al. (2008) on A356/SiC/10p composite conducted turning experiments using polycrystalline diamond (PCD 1500) inserts. Surface coarseness, explicit energy used and apparatus wear were found. Results showed that fast cutting rates result in comparatively easy elimination of stiff SiC particles. El-Gallab and Sklad (1998) examined the consequence of several cutting parameters on surface characteristics and the magnitude of the sub-surface damage caused by machining. PCD conducted cutting experiments. SEM pictures of machined surfaces show the existence of grooves and holes. Surface roughness quantities display that surface coarseness progresses through a rise in the rate of feed and cutting rate, but somewhat worsens with a rise in depth of cut. PCD tools and chemical vapour deposition (CVD) diamond-layered tools were used for turning A356/SiC/20p composite. Cutting forces, flank wear and surface coarseness were measured. Tool life arcs exhibited that feed does contrary to cutting speed. CVD diamond tools showed short tool life. PCD inserts are necessary for turning A356/SiC/20p composite to achieve extended tool life and minimum surface roughness (Davim, 2002). Kılıckap et al. (2005) identified 5% SiC-p Al MMC for the study of tool wear and surface roughness. K10 carbide inserts, both unlayered and TiN-layered, were tested under various machining conditions, including cutting rates of 150, 100 and 50 m/min, rates of feed of 0.3, 0.2 and 0.1 mm/rev, and penetration of cuts of 1.5, 1 and 0.5 mm. Under dry machining conditions, tool wear was predominantly governed by cutting rate, aggregately noticeable as the speed increased. The TiN-coated tool exhibited poorer wear than the uncoated insert. Surface roughness was mainly prejudiced by the speed of cutting and feed speed, where the upper speed of cutting combined with a lower rate of feed resulted in an improved surface finish.
The powder metallurgy route was used to fabricate AA2124/SiC-p composites. Surface coarseness was selected as the dependent variable. PCD tools were used for turning. Response surface-based D-optimal design of 29 trials was considered. An ANN method was used to forecast surface coarseness. Results exhibited that the size of SiC particles affects surface roughness significantly (Basheer et al., 2008). Nose radius reinforces the tool tip by thinning of the chip, where it reaches the tool point, and by scattering the chip over a bigger nose radius. Surface roughness is also reduced since tool inscriptions are not so deep as those made by a sharp tool (Lindberg, 1990). Ozben et al. (2008) prepared MMCs by mixing 15, 10 and 5 wt% of SiC-p in AlSi7Mg2. The mechanical properties of the composite were evaluated with respect to varying reinforcement ratios. The impact of the rate of cutting, the rate of the feed and the penetration of the cut on tool degradation and surface coarseness was also assessed. A higher proportion of SiC particles resulted in increased tool degradation, and surface coarseness was found to be predominantly influenced by the rate of feed and speed of cutting.
The above literature has shown that little work has been done with the objective of reducing energy usage and improving surface finish while machining AA7075/15 wt% SiC (10–20 µm) composites. This exploration effort is needed to know the outcome of the rate of the feed, speed of cutting, radius of nose, depth of cut on energy consumption and surface coarseness. A face-centred central composite design was utilized to design the testing. Multi-response optimization of turning factors was done by a desirable methodology to reduce the energy used and surface roughness. The novelty of this examination is that, so far, very little exploration has been reported about the finding of optimal process parameters for turning the AA7075/15 wt% SiC (10–20 µm) composites at which minimum electrical energy will be consumed, and surface roughness will also be minimum.
Investigational Work
Fabrication of AA7075/15 wt % SiC (10–20 µm) Composite
Stir casting set-up shown in Figure 1 was used to fabricate the composite.
Figure 1. Stir Casting Set-up.

EDAX Analysis of AA7075/15 wt% SiC (10–20 µm) Composite
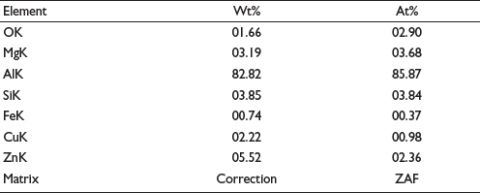
Figure 2 and the corresponding table show that wt% of Al is 82.82%. Wt% of Zn is 5.52%. Si wt% is 3.85%.
Figure 2. EDAX Profile of AA7075/15 wt% SiC (10–20 µm) Composite.

Table 1. Details of Inserts and Tool Holders.

Machining
Tool Holders and Inserts
Particulars of inserts and tool holders used for turning on the CNC machine are tabulated in Table 1.
Inserts and tool holders shown in Table 1 were used for turning experiments.
AA7075/15 wt% SiC (10–20 µm) composite fabricated by means of stir casting was utilized for this investigation. Machining was done by CNC. The desired choice of the penetration of cut, speed of cutting and rate of feed can be achieved on CNC. Carbide inserts CNMG 120404EM, 120408EM and 120412EM grade 6615 were intended for turning. Choices of factors for experiments were finalized centred on the literature review and pilot experiments. Stages of factors are shown in Table 2. Electricity consumption was determined through a wattmeter, and a surface roughness tester measured surface roughness.
Table 2. Three-level Machining Parameters.

Figure 3. Tungsten Carbide Inserts Used in Experiments Before Machining.

Figure 4. Wear of Tungsten Carbide Inserts Used in Experiments.

Tungsten carbide inserts of nose radius 0.4 and 1.2 mm used in experiments before machining are shown in Figure 3.
Cutting speed = 90 m/min, Feed = 0.25 mm/rev, Cutting speed = 90 m/min, Feed = 0.25 mm/rev, DOC = 0.6 mm, Nose radius = 1.2 mm. DOC = 0.6 mm, Nose radius = 0.4 mm.
Wear of tungsten carbide inserts of nose radius 0.4 and 1.2 mm used in experiments after machining is shown in Figure 4. The CNC turning machine is displayed in Figure 5.
Micrographs of the machined surface in Figure 6 show that SiC particles are uniformly distributed. There is no pull-out of SiC particles.
Figure 5. CNC Turning Machine.
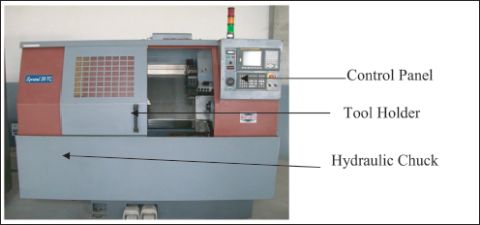
Figure 6. Micrographs of Machined Surface.

Response Surface Methodology
Box and Wilson (1951) had suggested RSM for optimization of factors. RSM is modelling technique for finding association among numerous parameters and responses (Myers & Montgomery, 1995).
Face-centred Central Composite Design (FCCCD)
FCCCD is used when non-allowable functional circumstances occur at one specified level of design region. FCCCD necessitates only three stages of every trial variable (Montgomery, 2001).
Experimental Design
AA7075/15 wt% SiC composite was machined through tungsten carbide inserts on a CNC turning set-up in accordance with the experimental scheme shown in Table 3.
Table 3. FCCCD for Four Variables at Three Levels.

Table 4. Pooled ANOVA: Surface Roughness.

Note: *The result is significant at the 95% confidence limit.
Results
Variance Study
Analysis of variance was applied to assess the statistical significance of findings. Pooled form of ANOVA for surface coarseness is described in Table 4 and for energy consumption in Table 5.

Table 5. Pooled ANOVA: Energy Consumption.

*The result is significant at the 95% confidence limit.
‘Adeq. precision’ calculates the signal-to-noise ratio. A ratio of more than 4 is desired. The ratio of 59.88 means a sufficient signal.

Coefficients of the Second-order Regression Equation
Regression coefficient of second order was found by utilizing investigational information (Table 3). The responses were modelled using regression equations as functions of the four process parameters measured in this experimentation. The results are presented below, and inconsequential coefficients have been excluded from the regression equations.
 (1)
(1)
 (2)
(2)
Analysis for Surface Roughness [AA7075/15 wt% SiC (10–20 µm) Composite]
Figure 7 represents the normal probability of residuals. Normal plot vs. residuals exhibits data when 98% of residuals would lie inside 3σ. These experimental data are inside three 3σ. Predicted vs. actual (Figure 8) is quantified to demonstrate how efficiently the line can fit the two. The graph displays how this model foretells the range of data. Figure 8 indicates that experimental data align closely with a straight line.
Residual vs. run order is shown in Figure 9. It displays that errors are independent. Results are not influenced by time-related outside factors. There is a random, horizontal band of points around the zero line. No discernible trends or patterns are witnessed.
Figure 7. Normal Probability Distribution of Residuals: Surface Roughness.
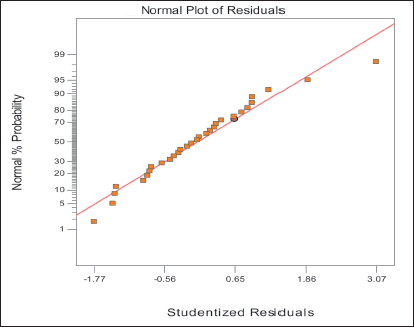
Figure 8. Predicted vs. Actual Surface Roughness.

Figure 9. Residual vs. Run Order.
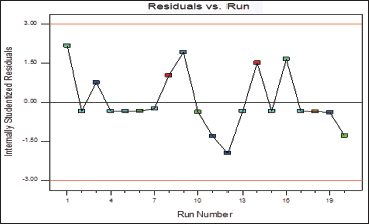
Figure 10. Box–Cox Transformation.
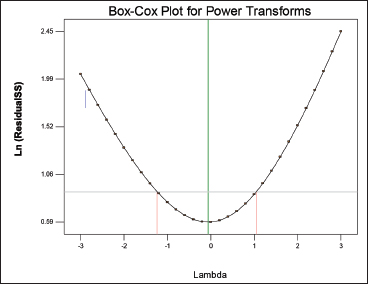
The Box–Cox transformation is shown in Figure 10. This power transformation shows that variance is stabilized. The data are more normally distributed. Normality is important in this case.
Impact of Parameters on Surface Roughness
Figure 11(a) expresses the surface graph of surface coarseness, namely fluctuating speed of cutting and feed speed. The figure indicates that the escalation in the rate of cutting first upsurges, then lessens surface roughness. Growth in feed augments surface roughness. Figure 11(b) shows the impact of the speed of cutting and the penetration of the cut on surface coarseness. A rise in the penetration of cut enhances surface coarseness. Figure 11(c) represents the consequence of the speed of cutting and nose radius on surface coarseness. It is witnessed that surface coarseness will be lower when the nose radius is larger. Commencing these graphs, it is noticed that lesser surface roughness can be found only at minor values of feed and the penetration of cut, and greater levels of the speed of cutting and radius of nose.
Figure 11. 3D Surface Curves for Surface Roughness (µm). (a) Impact of Cutting Speed and Feed on Surface Finish. (b) Surface Roughness Response to Speed of Cutting and Penetration of Cut. (c) Impact of Speed of Cutting and Radius of Nose on Surface Roughness.

Analysis for Energy Consumption
Normal curve vs. residuals expresses residual information where 98% of residuals shall lie within 3 sigma. This investigational information is in 3 sigma (Figure 12). Residual vs. predicted is a quick test to ensure proper randomization is evident. Figure 13 indicates that experiments are properly randomized.
Figure 12. Normal Probability of Residuals: Energy Consumption.
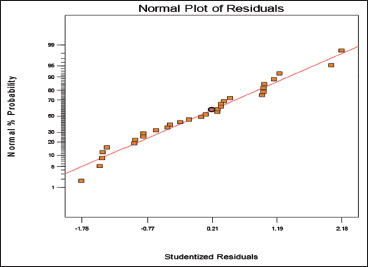
Figure 13. Predicted vs. Actual: Energy Consumption.

Effect of Factors on Energy Consumption
Figure 14(a) shows the surface curve of energy consumption, namely varying speed of cutting and feed. Electricity consumption improves sharply with the growth in the speed of cutting. Increasing the feed rate has minimal effect on energy consumption.
Figure 14(b) displays the consequences of a change in the speed of cutting and penetration of the cut on energy utilization. A rise in the penetration of cut augments energy utilization. It is witnessed that lesser energy utilization can be attained at a lesser penetration of the cut. Figure 14(c) depicts the influence of the speed of cutting and the radius of the nose on energy feeding. It is witnessed that energy utilization is increased when the nose radius is high.
Figure 14. 3D Surface Curve for Energy Consumption (watt). (a) Impact of Speed of Cutting and Rate of Feed on Energy Utilization. (b) Impact of Speed of Cutting and Penetration of Cut on Energy Utilization. (c) Impact of Speed of Cutting and Radius of Nose on Energy Utilization.

Optimization of Cutting Parameters Using a Multi-objective Approach
A response optimization study was conducted to attain the least surface roughness and energy consumption by utilizing developed mathematical models. The desirability function method was utilized.
Desirability Function Approach
The value of desirability ranges between d = 0 and 1, which means the outcome is not acceptable. 1 means the response is the correctly targeted value (Jinshan et al., 2007). The response is converted into desirability as follows:
 (6)
(6)
and d =1 for y- >L.
α is weight. L and U were finalized as per the mathematical model in RSM.
Design-Expert was utilized for analysis. The desirability method was used for obtaining optimum results utilizing multi-response objectives (Dhupal et al., 2008; Jinshan et al., 2007). Optimization was carried out in two stages: (a) finding desirability for response and (b) maximization of desirability and detecting the optimum value. In the desirability approach, various results were achieved. Solution with maximum desirability is favoured.
Limitations for Optimization of Cutting Parameters
Desirability analysis was conducted to minimize surface coarseness and energy consumption simultaneously while allowing the parameters to vary from low limit to high limit.
Multi-Objective Optimization Results
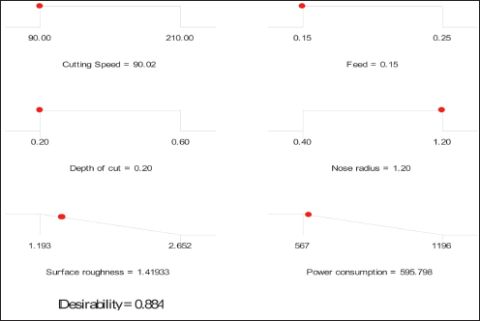
Surface roughness and energy ingestion were minimized as per constraints in Table 6, through desirability analysis. A total of five solutions were generated. These are arranged in Table 7. Solution 1 at maximum desirability, that is, 0.884, is preferred. Optimum amount of the speed of cutting, rate of feed, penetration of cut and radius of nose to reduce surface coarseness (1.149) and energy ingestion (595.79 watt) are 90.02 m/min, 0.15 mm/rev, 0.20 mm and 1.20 mm.
Figure 15 shows a contour chart at the maximum desirability amount. Figure 16 and Figure 17 show a contour graph of surface roughness and energy consumption. Point prediction for multi-response optimization is shown in Table 8. Results show that variations are within limits.
In Figure 18, the red points on the graphs show optimum values. Red points on curves response also show corresponding values of surface roughness and energy consumption. Figure 19 shows individual and combined desirability values. Desirability amount for surface roughness is 0.813, and desirability amount for energy consumption is 0.972. Their combined desirability value is 0.884.
Table 6. Limitations for Optimization of Values.

Table 7. Multi-criteria Optimization Results.

Table 8. Point Prediction: Multi-response Optimization.

Figure 15. Contour Graph at Maximum Desirability.

Figure 16. Contour Chart Surface Roughness: Cutting Speed.

Figure 17. Contour Chart Energy Consumption: Cutting Speed.

End Result
Experimental (minimum), single objective and multi-objective values of surface roughness are 1.193, 1.191 and 1.419 µm, respectively. Experimental (minimum), single-objective optimization and multi-objective optimization values of energy utilization are 567, 566.71 and 595.79 watts, respectively. This shows that simultaneous optimization (multi-criteria optimization) of surface roughness and energy utilization is at the cost of % rise in surface roughness and % increase in power utilization as related to their single criteria optimization values.
Figure 18. Ramp Function Curve for Combined Desirability.
The % change in surface roughness owing to multi-objective optimization

The % change in energy consumption due to multi-objective optimization

Hence, 16.06% reduction in surface roughness can be achieved by merely increase of 4.88% in energy consumption.

Figure 19. Individual and Combined Desirability Value.

Experimental Validation of Results
Turning experiments were carried out again at the optimal cutting conditions obtained by desirability analysis for AA7075/15 wt% SiC (10–20 µm) composite. The values of response parameters, that is surface roughness and electricity consumption, are close to values obtained by desirability analysis. This validates our work.
Discussions
Surface Roughness
Surface roughness (Ra) obtained on turned surfaces of composite rods was greater than that of alloys. Throughout turning, pulling of SiC particles results in minor holes on the turned surface. This situation resulted in the rise of the surface roughness of composites. Surface coarseness of composite rods that have a greater reinforcement ratio is more than that of rods that have a comparatively lower reinforcement ratio.
Surface roughness affects the performance of components when they are used in a mechanism. It also evaluates the machining accuracy. The speed of cutting, rate of feed, penetration of cut and nose radius have a major influence on surface roughness. Semi-continuous chips are formed during the turning of AA7075/SiC-p composites. This is a result of the presence of SiC particles. Discontinuous chips create macro cracks on the open surface of chips. This leads to bend creation. That sequentially removes SiC particulates, which leads to the formation of minor cavities on the surface during turning. This is also one of the reasons for more surface roughness while turning Al/SiC composites.
Outcome of Speed of Cutting
Cutting speed has a major impact on surface roughness. Surface roughness reduces at greater cutting speeds (Figure 11a). The chip fractures freely at a lower cutting speed. This produces a rough surface. This is because of the existence of harder SiC particles. SiC particles do not play a major role in cutting at low speed. Cutting at low speed is due to the cutting tool side. SiC particulates slide on the tool edge and damage the turned surface. As the speed rises, chip fracture reduces and hence roughness declines. The speed of cutting has the maximum intense influence on surface roughness. At large, when higher cutting speeds are utilized, less surface roughness can be attained.
Outcome of Rate of Feed and Penetration of Cut
Increase in feed augments surface roughness (Figure 11b). When the feed is raised, regular loads on the tool are also enhanced. Hence, it will produce heat, which further enhances surface roughness. Rise in the penetration of the cut produces more regular pressure and concentrates on the rake surface. Henceforth, surface coarseness augments with growth in depth of cut (Figure 11c).
Surface coarseness is enhanced at greater feed in all turning circumstances. This was ascribed to the elevated temperature in the cutting zone. Greater feed enhances temperature, and this leads to reduced bonding amongst SiC-p and Al matrix. Al relaxes, and SiC particles are released.
Effect of Nose Radius
Chip thickness changes from zero to extreme while turning by a large nose radius tool, which tends to move a big part of the chips in place of cropping them. This decreases surface roughness (Figure 11c). A bigger nose radius minimizes the saw tooth’s impact of feed marks and considerably lessens surface roughness. An additional nose radius is nevertheless detrimental since it creates vibration and chatter.
Energy Consumption
Influence of Speed of Cutting and Feed Rate
Figure 14(a) shows the surface curve of energy consumption with changing speed and feed. Energy consumption increases sharply with a rise in speed. As speed rises, the material removal rate also enhances compelling machine to draw extra energy. Wear of the tool also results in extra energy consumption, as the turning process is not smooth.
Normally, as speed rises, the heat created at the interface of the tool and component increases. Hence, the major part of the heat generated enters the component. Increased heat generation results in softening of the Al matrix. In AA7075/15 wt% SiC (10–20 µm) composite turning, the major part of electricity is spent in eradicating hard reinforcement particles from the gluey matrix. Numerous investigations (Lin et al., 1995; Tomac & Tonnessen, 1992) have shown that normally reinforcements are moved out from the matrix instead of being cropped. Thus, higher speed results in relaxation of the matrix. This reduces specific energy. Therefore, MMC turning should be conducted at greater speeds. Speed will be limited by tool wear, as raising speed after a value will result in rapid tool wear and become economically nonviable (Andrews et al,. 2000; Muthukrishnan et al., 2008). The rise in feed has a slight impact on the energy utilization.
Influence of Depth of Cut
Figure 14(b) displays the impact of the speed of cutting and the penetration of the cut on energy utilization. Rise in depth of cut improves energy consumption in turning of AA7075/15 wt% SiC (10–20 µm). It is observed that less consumption can be attained at a minor depth of cut (Kumar, 2013).
Effect of Nose Radius
Figure 14(c) depicts the effect of cutting speed and radius of nose on energy consumption. It is observed that energy consumption is additional at a large nose radius. Alike results were attained by Kumar (2013).
Conclusions
The following conclusions can be drawn:
Relate the Optimization Results to Practical Machining Strategies
When the turning of composite will be carried out at process parameters obtained from multi-response optimization, there will be a reduction in the surface roughness of the machined surface, with a marginal increase in electrical energy consumption. These values of process parameters may be used for the turning of composites.
Limitations
It will be difficult to machine the composites, with more than 15 wt% of SiC particles and particle size more than 20 µm.
Directions for future research
Limited research has been conducted on the machining behaviour of metal–matrix composites. A number of problems during the machining of MMC still need a solution. Some of them are:
Declaration of Conflicting Interests
The author declared no potential conflicts of interest with respect to the research, authorship and/or publication of this article.
Funding
The author received no financial support for the research, authorship and/or publication of this article.
Andrews J. E., C., Feng, H.-y., & Lau, W. M. (2000). Machining of an aluminium–SiC composite using diamond inserts. Journal of Materials Processing Technology, 102, 25–29.
Antony, J. (2000). Multi-response optimization in industrial experiments using Taguchi’s quality loss function and principal component analysis. Quality and Reliability Engineering International, 16, 3–8.
Basheer, A. C., Dabade, U. A., Joshi, S. S., Bhanuprasad, V. V., & Gadre, V. M. (2008). Modeling of surface roughness in precision machining of metal matrix composites using ANN. Journal of Materials Processing Technology, 19–7, 439–444.
Box, G. E. P., & Wilson, K. B. (1951). On the experimental attainment of optimum conditions. Journal of Royal Statistical Society, 13, 1–45.
Choudhury, I. A., & EI-Baradie, M. A. (1997). Surface roughness prediction in the turning of high-strength steel by factorial design of experiments. Journal of Materials Processing Technology, 67, 55–61.
Davim, J. P. (2002). Diamond tool performance in machining metal–matrix composites. Journal of Materials Processing Technology, 128, 100–105.
Dhupal, D., Doloi, R., & Bhattacharyya, B. (2008). Parametric analysis and optimization of Nd:YAG laser micro-grooving of aluminium titanate (Al2TiO5) ceramics. International Journal of Advanced Manufacturing Technology, 36(9–10), 883–893.
El-Gallab, M., & Sklad, M. (1998). Machining of Al:SiC particulate metal matrix composites Part II: Workpiece surface integrity. Journal of Materials Processing Technology, 83 277–285.
Jinshan, L., Cuiqing, Y. M., Yan, L., Wei, Z., & Ping, X. (2007). Medium optimization by combination of response surface methodology and desirability function: An application in glutamine production. International Journal of Advanced Manufacturing Technology, 74, 563–571.
Kılıckap, E., Cakır, O., Aksoy, M., & Inan, A. (2005). Study of tool wear and surface roughness in machining of homogenised SiC-p reinforced aluminium metal matrix composite. Journal of Materials Processing Technology, 164–165, 862–867.
Kumar, B. R. (2013). Optimization of cutting parameters for minimizing power consumption and maximizing tool life during machining of Al alloy SiC particle composites. Journal of Cleaner Production, 39, 242–254.
Lee, B. Y., Tarng, Y. S., & Lii, H. R. (2000). An investigation of modeling of the machining database in turning operations. Journal of Materials Processing Technology, 105, 1–6.
Lin, J. T., Bhattacharyya, D., & Lane, C. (1995). Machinability of a silicon carbide reinforced aluminium metal matrix composite. Wear, 181–183, 883–888.
Lin, W. S., Lee, B. Y., & Wu, C. L. (2001). Modeling the surface roughness and cutting force for turning. Journal of Materials Processing Technology, 108, 286–293.
Lindberg R. A. (1990). Processes and materials of manufacture (4th ed.). Prentice-Hall.
Montgomery D. C. (1997). Design and analysis of experiments (4th ed.). Wi1ey.
Montgomery D. C. (2001). Design and analysis of experiment (5th ed.). Wiley.
Muthukrishnan, N., Murugan, M., & Prahlada Rao, K. (2008). Machinability issues in turning of Al-SiC (10p) metal matrix composites. The International Journal of Advanced Manufacturing Technology, 39, 211–218.
Myers, R. H., & Montgomery, D. C. (1995). Response surface methodology: Process and product optimization using design experiments. John Wiley & Sons.
Ozben, T., Kilickap, E., & Cakır, O. (2008). Investigation of mechanical and machinability properties of SiC particle reinforced Al-MMC. Journal of Materials Processing Technology, 198, 220–225.
Thiele, J. D., & Melkote, S. N. (1999). Effect of cutting-edge geometry and workpiece hardness on surface generation in the finish hard turning of AlSI 52100 steel. Journal of Materials Processing Technology, 94, 216–226.
Thomas, H., & Chanderasekaran, H. (1997). Influence of cutting medium on tool wear during turning. Report IM-3118, Swedish Institute for Metal Research.
Tomac, N., & Tonnessen, K. (1992). Machinability of particulate aluminium matrix composites. CIRP Annals, 41, 55–58.
Yang, W. H., & Tarng, Y. S. (1998). Design optimization of cutting parameters for turning operations based on Taguchi method. Journal of Materials Processing Technology, 84, 112–129.
